Predicting the Unpredictable: AI-Powered Weather Forecasting for Hailstorm in Japan
This post provide general information of a Hail Forecast system used in Hail Alert Service in Japan provided by MTI By harnessing state-of-the-art machine learning algorithms and analyzing extensive historical weather radar data, this system aims to:
- Improve accuracy and lead time: Provide more accurate and timely predictions of hail events.
- Enhance early warning systems: Empower weather information service providers to issue more precise and timely warnings to the public, allowing for swift evacuation and precautionary measures.
- Enable proactive risk management: Equip individuals, businesses, and government agencies with the necessary information to proactively assess risks and implement effective mitigation strategies.
I. Basics - What is hail?
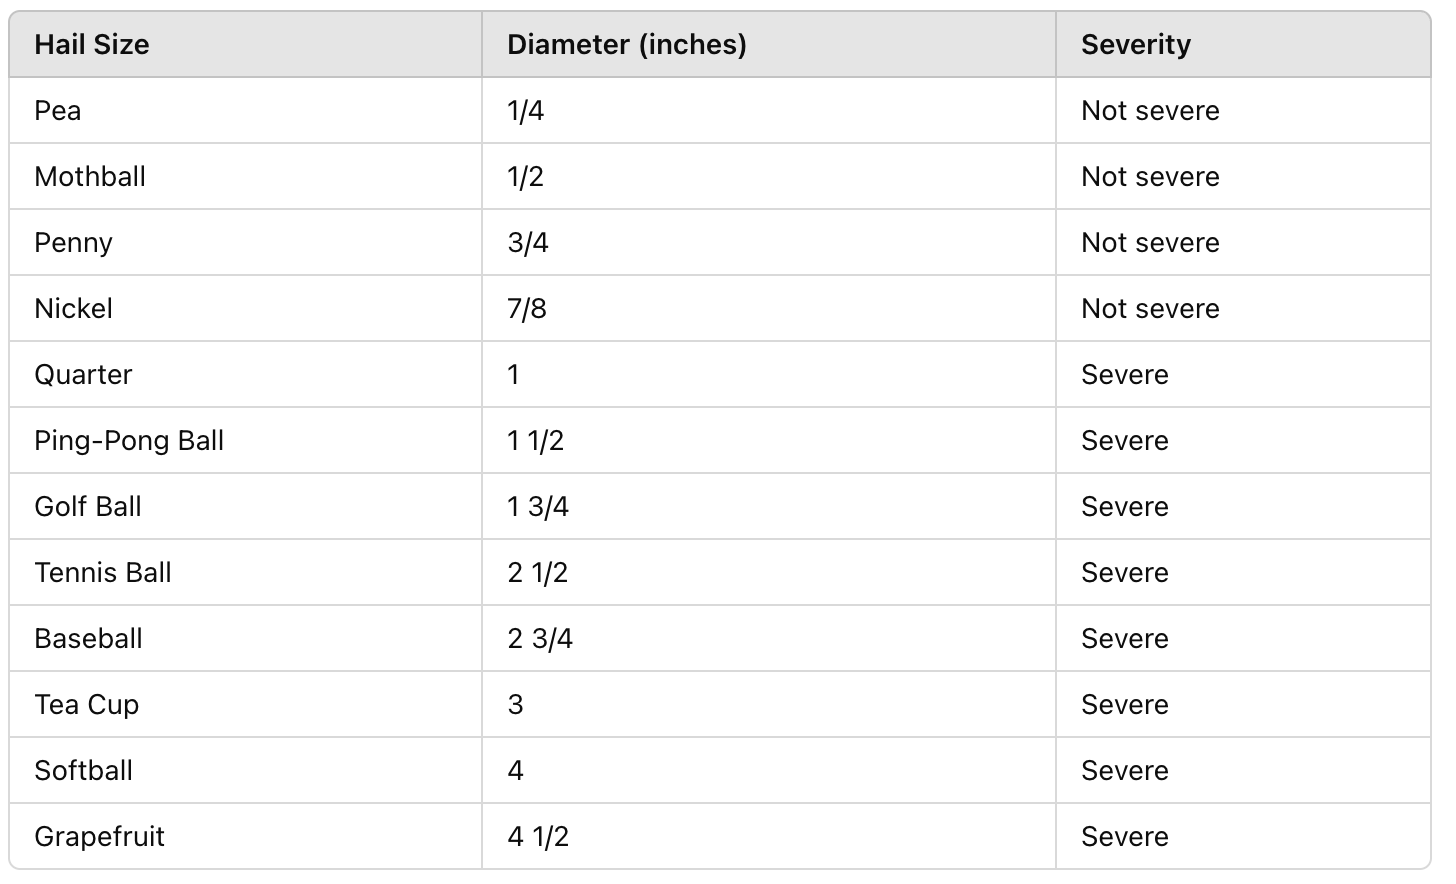
Table 1. Classification of hail sizes and their severity levels
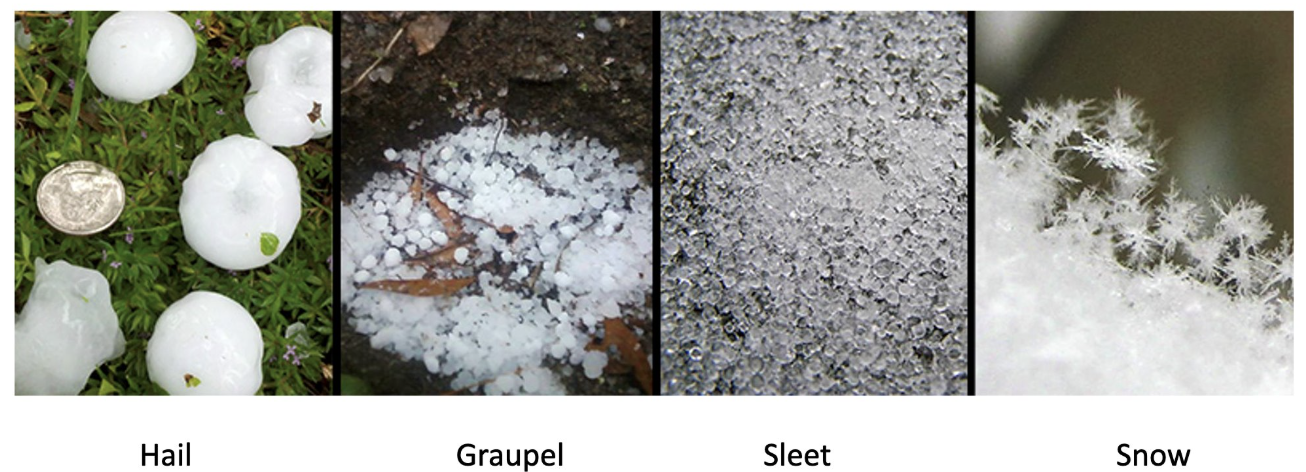
Fig 1. Illustration of Hail
II. Approaches to Predict Hail
Radar data, particularly reflectivity (Z) and Vertically Integrated Liquid (VIL), plays a crucial role in predicting hail due to its ability to provide detailed and real-time information about atmospheric conditions. High reflectivity values on radar indicate the presence of highly reflective targets, such as hailstones, making it a direct and effective indicator for hail detection. Similarly, VIL measures the total liquid water content in a vertical column of the atmosphere, which helps identify areas with high concentrations of supercooled droplets essential for hail formation. Compared to other methods like analyzing updraft strength or temperature zones, radar-based approaches offer the advantage of immediate and localized insights, enabling meteorologists to track and predict hail events with greater precision and timeliness. This makes radar data an invaluable tool for real-time monitoring and early warning systems.
High Reflectivity Detection
- Use high reflectivity values to identify highly reflecting targets, which may indicate hail.
- Methods: CAPPI (Constant Altitude Plan Position Indicator) and ZMAX.
Liquid Water Content Analysis
- Detect areas with high liquid water content, as this may indicate the presence of supercooled droplets essential for hail formation.
- Methods: VIL (Vertically Integrated Liquid) and VILD (Vertically Integrated Liquid Density).
Updraft Strength and Melting Layer Analysis
- Identify strong updrafts capable of suspending hail-sized targets, ensuring a supercooled water supply and analyzing the vertical extent of the melting layer.
- Method: Waldvogel.
Above-Freezing Temperature Zone Analysis
- Focus on the area above the 0 °C isotherm, where hail is likely to form.
- Method: POSH (Probability of Severe Hail).
III. Proposed Solution: Leveraging Reflectivity and VIL for Hail Prediction
1. Data Preparation
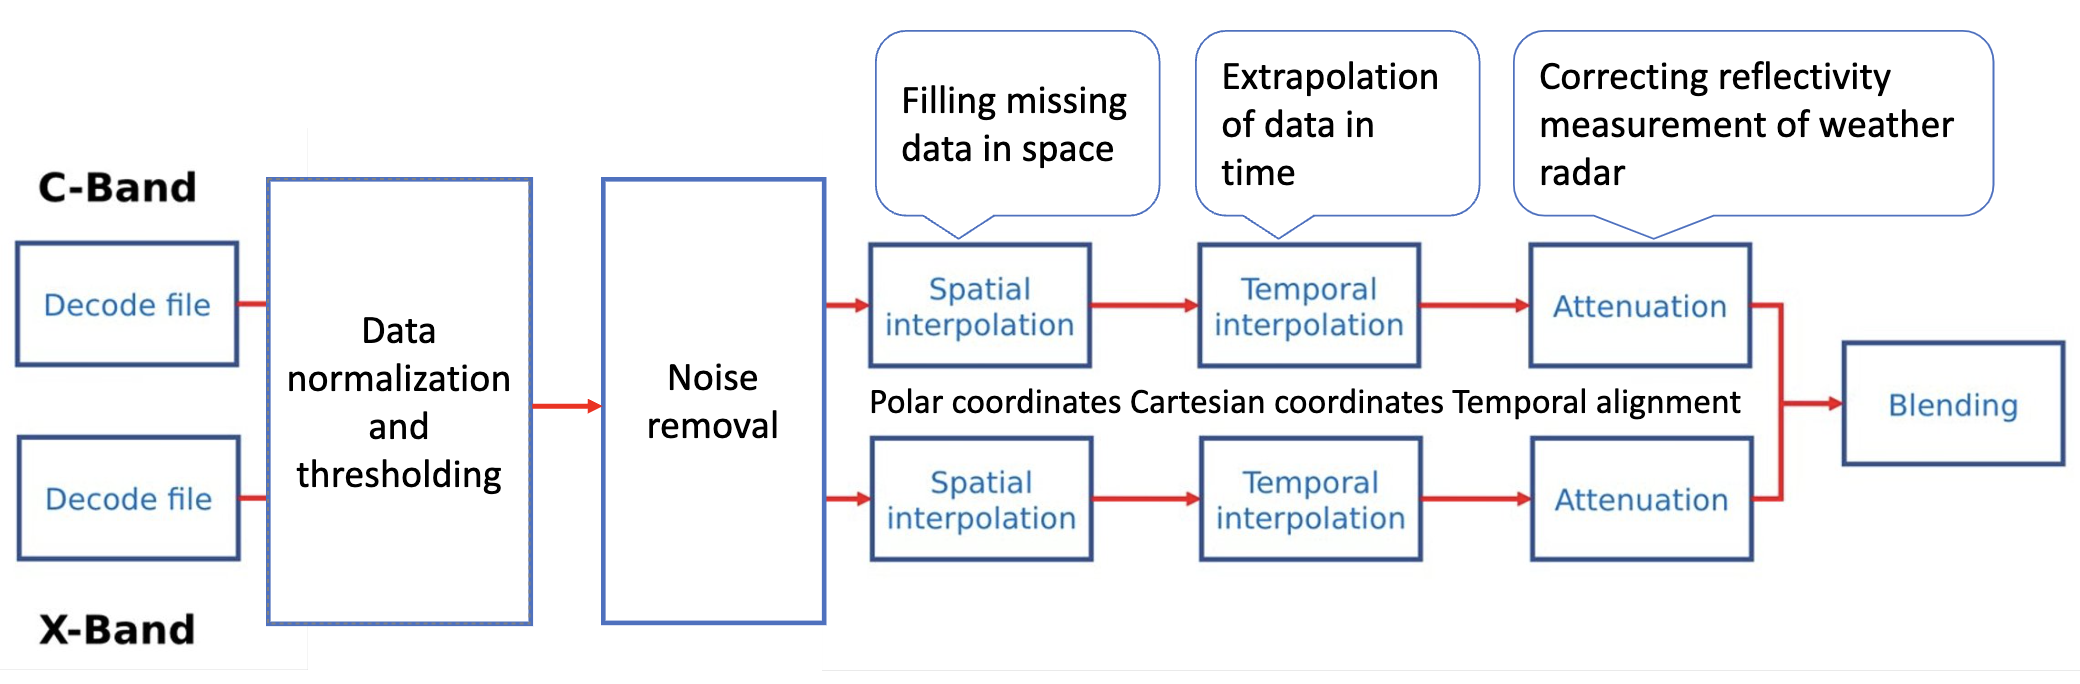
Fig 2. Data processing pipeline
This flowchart illustrates the process of generating composite radar data from raw inputs, specifically using C-Band and X-Band radar systems. The steps are as follows:
- Decode File: Raw data from both C-Band and X-Band radar systems is decoded.
- Data Normalization and Thresholding: The decoded data is normalized and thresholded to standardize it for further processing.
- Noise Removal: Noise in the radar signals is removed to enhance data quality.
- Filling Missing Data in Space: Missing spatial data is interpolated using spatial interpolation methods in both polar and Cartesian coordinates.
- Extrapolation of Data in Time: Temporal interpolation is performed to address gaps in the time dimension, ensuring continuity in radar measurements.
- Correcting Reflectivity Measurement: Radar reflectivity values are corrected to account for attenuation and inaccuracies in measurements.
- Attenuation Adjustment: Attenuation effects are corrected for better accuracy.
- Temporal Alignment: Data from both radar bands is aligned temporally to ensure consistency.
- Blending: Finally, the processed data from both radar bands is blended to generate a unified composite dataset for further analysis or visualization.
Figure 3 show the pre-processed data (reflectivity - Z) for forecast pipeline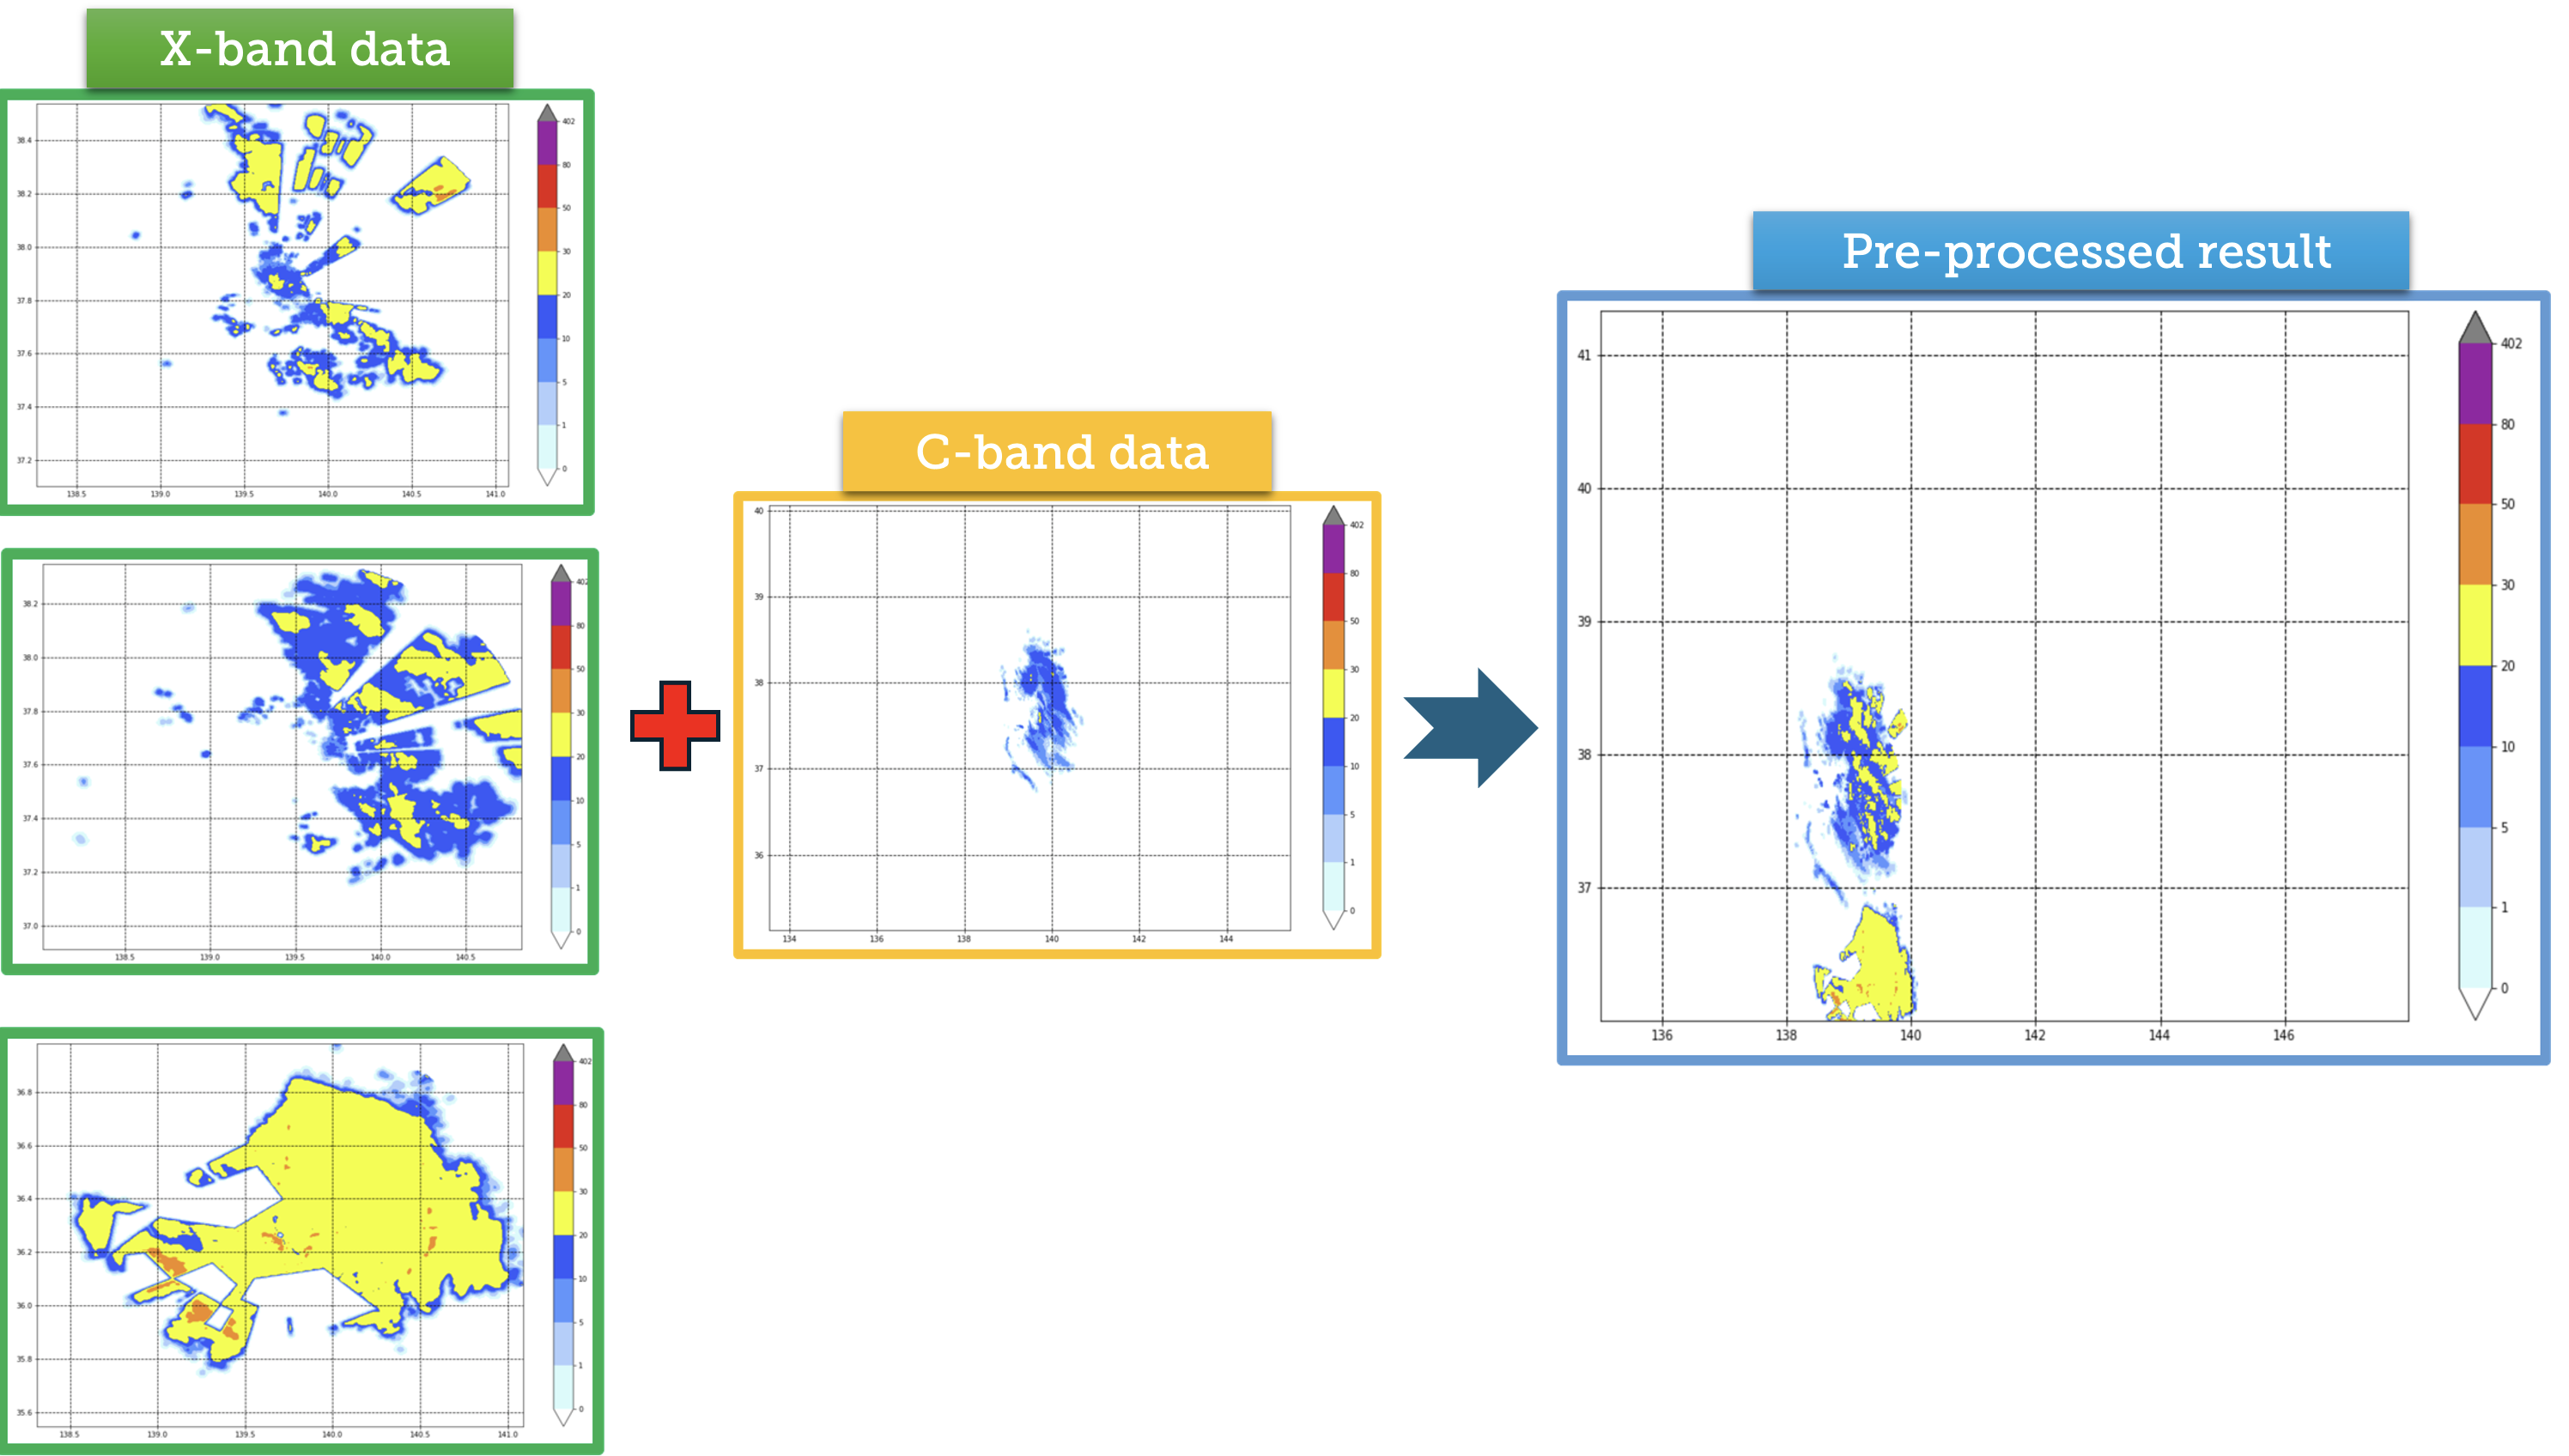
Fig 3. Pre-processed data for hail forecast
2. Forecast pipeline
The forecasted results will be provided at a single timestamp, which is specified in the groundtruth dataset. The pipeline employs motion estimation over a sequence of 3 frames to generate predictions. In our experiment, we also account for the processing time of the Nowcast system to manage latency in data transmission. The forecasting model predicts the time at a 30-minute ahead window based on the following formula:
Predicted time [at t] = Forecast (observed_data [from t-50 to t-30])
This approach ensures that the prediction incorporates relevant historical data within the specified range, helping to maintain accuracy despite the latency introduced by the system’s processing time.
Figure 4 show the AI-based forecast pipeline.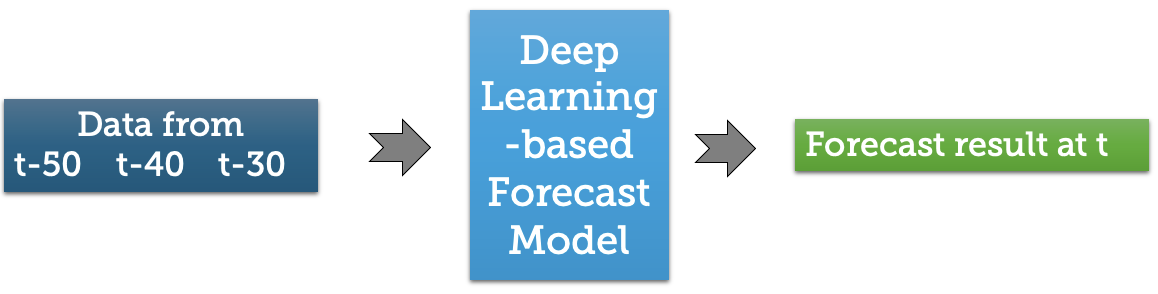
Fig 4. Forecast pipeline
III. Demonstration
Figure 5 show forecasted result at Kanto region on 03/06/2022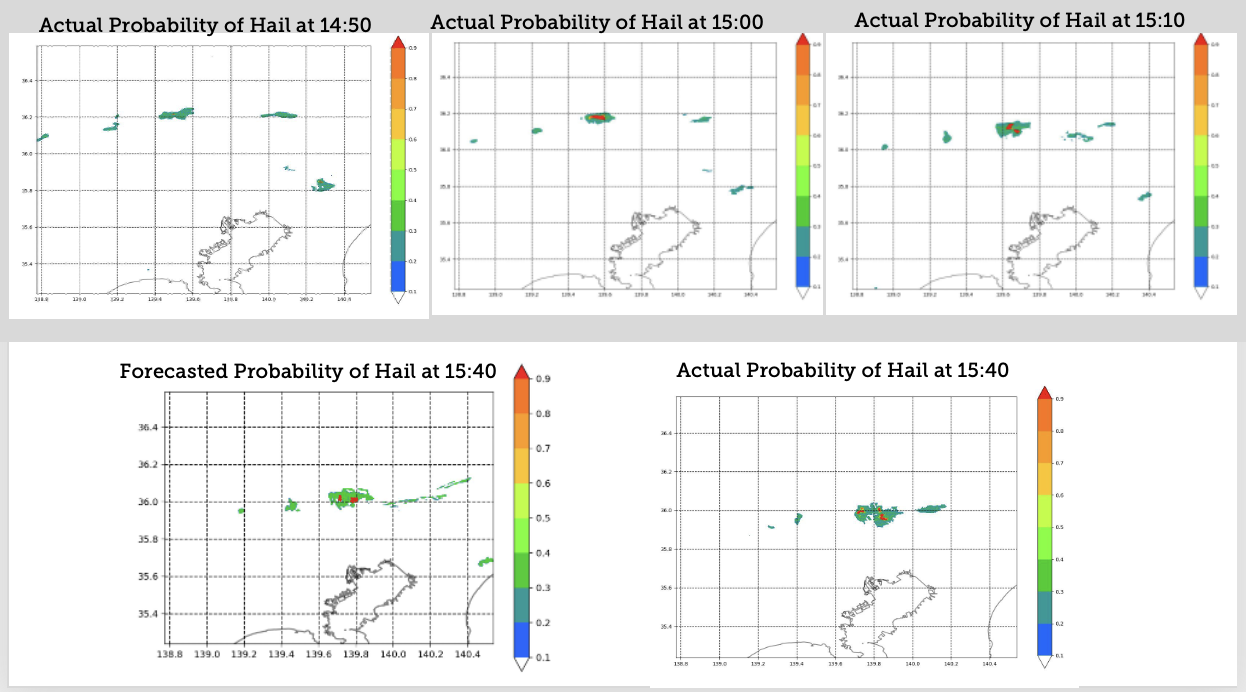
Fig 5. Forecasted result at Kanto region